Hazel-eyed visitors are more likely to buy your product : Insight or illusion? - II
Is your latest Analytics Insight a real signal or random noise? We try to understand how Statistical Significance can help us answer this question.
Dec 28, 2017

Hazel-eyed visitors are more likely to buy your product : Insight or illusion? - II
Is your latest Analytics Insight a real signal or random noise? We try to understand how Statistical Significance can help us answer this question.
Dec 28, 2017
Note : Post 1 on the subject (explaining what Statistical Significance is and why you need to care about it) is here.
Statistical Significance or certainty of your insight can be calculated in more than one ways with each way being suitable to a certain kind of data. This requires you to decide what method will suit for your experiment:
Chi-squared Test
A Chi-squared test is used when you are trying to find a possible relationship between two independent variables. For example, you believe that millennials are most probable to use overnight delivery for their orders. A Chi-squared test would allow you to find if there is any relationship between age of your visitors and kind of delivery they select for their orders. The data from your experiment in a tabular form similar to that below shall be input to get Chi-square Statistical Significance P-value:
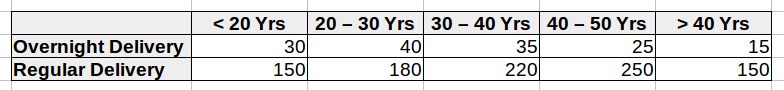
Examples of experiments where Chi-squared Test would be suitable:
Fisher's Exact Test
Fisher's exact test shall be used instead of Chi-squared test when the sample sizes are small. P-value from Chi-squared test is not accurate with smaller sample sizes.
Z-test
A Z-test is used when you want to compare the averages of two groups to determine if they differ with respect to a certain attribute. An important requirement for using Z-test is that you know the variation for the entire population. Lets say you observe that female students in a class score higher than the average. To find the Statistical Significance of this observation, you need to compare the average score of entire class with the average score of female students. Z-test fits here because you can find the variation for the score of entire class. But, in real-world scenarios, variation for entire population is rarely known.
T-test
A T-test is used instead of Z-test when the variation of entire population is not known. Suppose you observe that the average time a visitor spends reading your blog post doubles if the visitor comes from your subscription email as compared to other sources. We cannot use Z-test here because we can ascertain the time spent by visitor reading only for a certain duration (sample) but not forever (population).
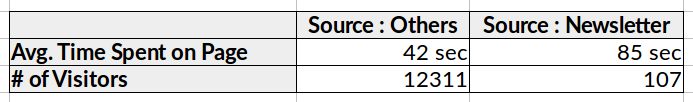
Examples of experiments where T-test would be suitable:
One-tailed or Two-tailed Significance Test
The previous post suggested that a p-value of 0.05 means that you can be 95% certain that the pattern you observe is a valid insight. But, to be sure your p-value is accurate, you need to know whether your experiment is one-tailed or two-tailed:
One tailed test:
Let's say you are running an experiment to know if faster site speed will improve your sales. So, you analyze to see if users on faster networks made more purchases. You expect that the users in fast group will either make sales that is equal to your over-all average sale or greater than that. Since your variation can lead the sales to go in only one direction, this is a one tailed test.
Two tailed test:
Let's say you are experimenting to find if more jazzy email subject lines improve your open-rates. So, you send half your subscribers the standard email subject lines and rest the more jazzy ones. The jazzy subject lines may improve your open rate, have no impact on your open rate or reduce the open rate. Since your variation can lead the open-rate to go in any of the two directions (improve or degrade), this is a two tailed test.
The reason we need to care about this is because P-value for a two-tailed test is always two times the P-value for a one-tailed test. This is because the P-value for a one-tailed test tells us how likely it is to observe the pattern with normal data in one direction. So, the likeliness of observing the pattern with normal data in two directions will be double of that.
If unsure, it is safe to assume you are performing a two tailed test.
Conclusion
A lot of what is detailed in this post may appear cumbersome and you may be tempted to skip it and try various online calculators. But trial-and-error can be risky. It is vital to understand the nature of your experiment to use the right Statistical Significance formulae and to interprete the results accurately.