Leading Indian Travel Aggregators : A speed showdown

An earlier post explained how to optimize our Site for visitors on slow networks and devices. Explanations are all good. But how about if we can see how these optimizations make a site's loading experience look like. In this post, we'll do that by seeing how the homepage for three leading Indian travel aggregator sites load up. On a fast and a slow network. The goal is to see the impact of optimizations. Especially on slower devices and networks.


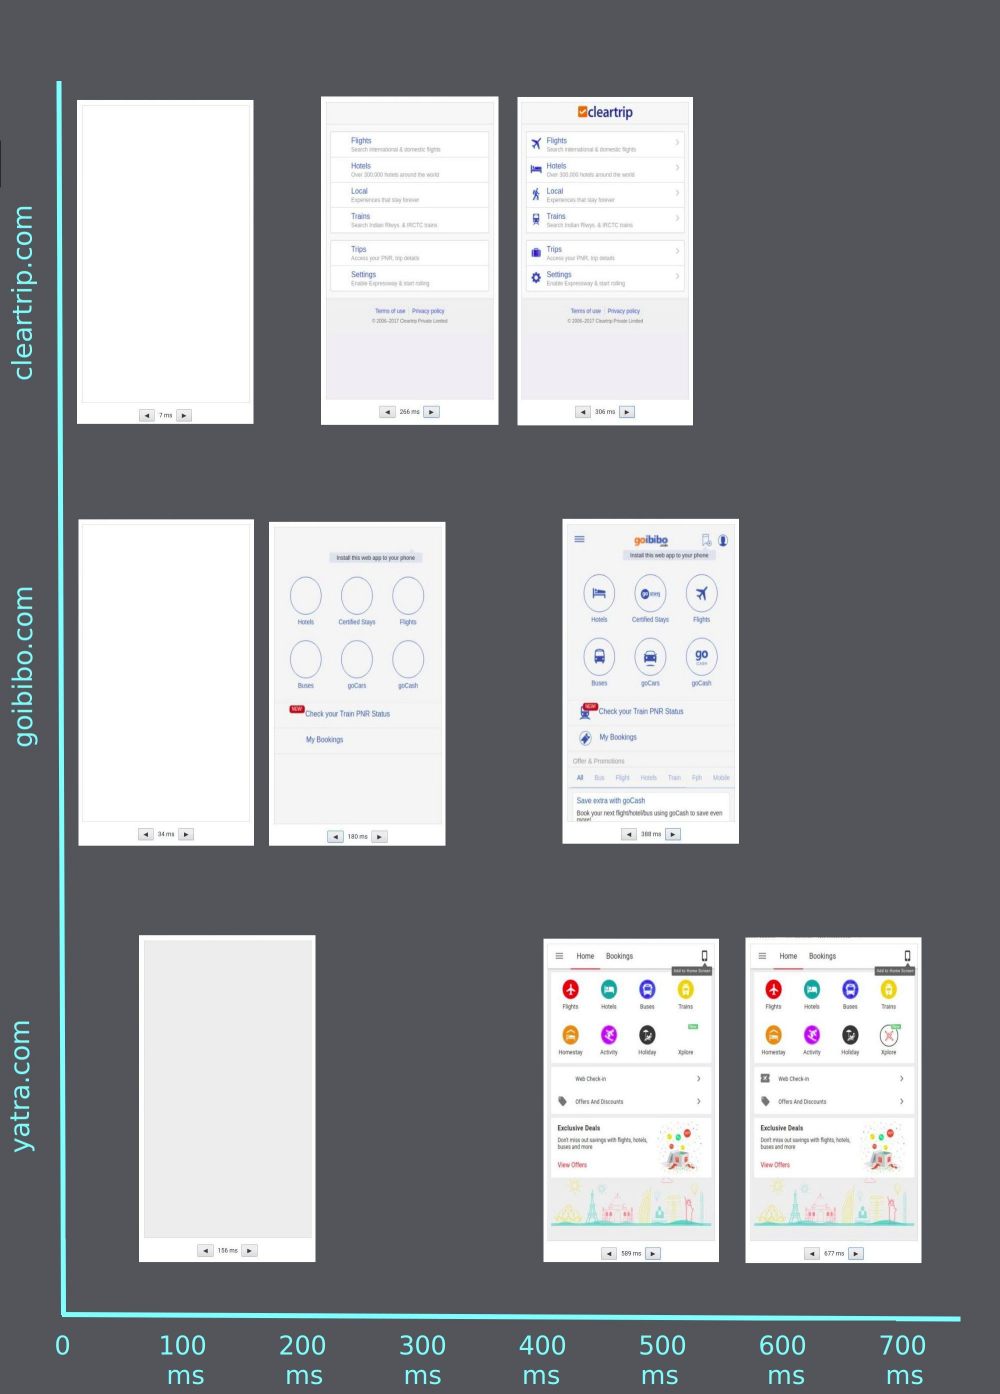
Page loading time for Leading Indian travel aggregators on a 16 Mbps Broadband network
Page loading time for Leading Indian Travel Aggregators on a
16 Mbps Broadband, Nexus 6P device


On a fast network, all the three pages load in under 1 second. The difference in the loading time for the three pages is not more than 200 msec. That should definitely not bother any visitor. Now, lets see how the same pages load up on a slower network:


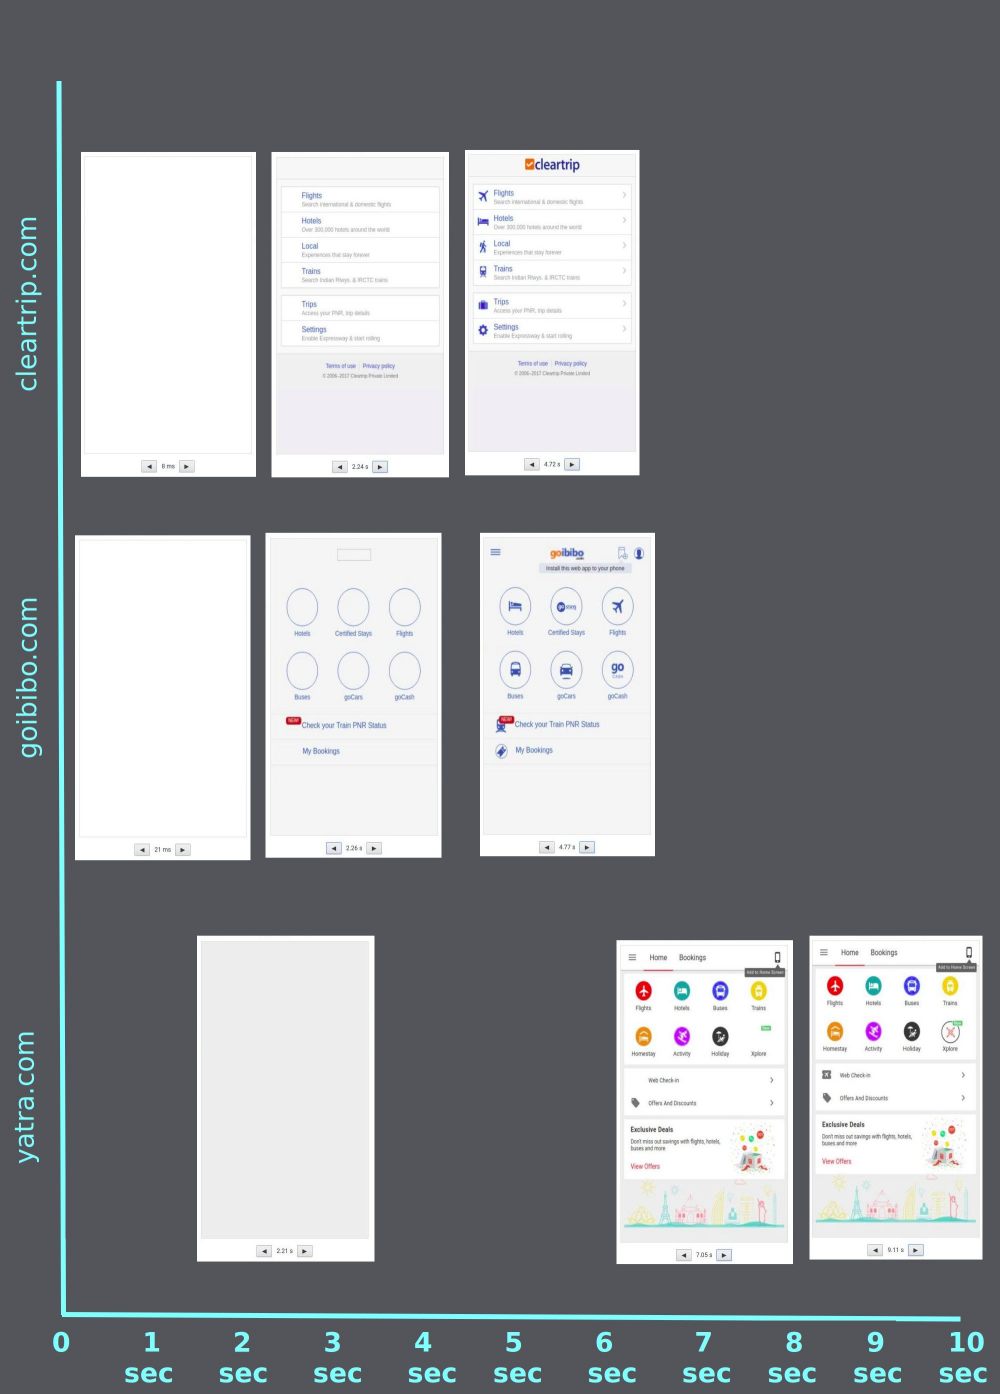
Page loading time for Leading Indian travel aggregators on a slow 3G network
Page loading time for Leading Indian Travel Aggregators on
slow 3G network, Nexus 6P device


Things look very different when the same pages are accessed on a slow 3G network. All the three pages load up slower. But, is the effect of slow network the same on all the three pages?


  • The first content for cleartrip.com and goibibo.com shows up in 2-3 seconds. The same happens for yatra.com at around 6 second mark. A difference of 3-4 seconds. On the fast network, the same difference was a few milliseconds.

  • Time to render first content increased for cleartip.com and goibibo.com by 9x on the slow network. The same increased for yatra.com by 12x.

  • The first screen that appears for cleartrip.com and goibibo.com is mostly text. No logo image or icons. The first screen for yatra.com is almost complete with the icons and images.

This shows how optimizing to show-up only the most critical content first-up helps reduce the waiting time for visitors. More so for visitors on slower networks and devices. And, reduced wait time helps push our conversions from these visitors.


Technical Details of the runs performed to obtain timings listed in images above:
  • Runs were done using Chrome Nexus 6P simulator on Nov 14th, 2017.
  • Caching was disabled for the runs.
  • Slow speed was simulated with Chrome 'Slow 3G' (750 KBps / 100ms RTT) throttling.
  • Fast speed was simulated with no throttling in place on a 16 Mbps broadband connection.
  • Page loading timings and screens were obtained using Chrome Devtools.